On April 21, 2026, OpenAI shipped ChatGPT Images 2.0, the first image model that can actually read what you ask it to write. That single change, readable text inside the image, is what finally turns ChatGPT into a real infographic and poster tool for everyday users. No more gibberish headlines. No more broken bullet points. You type the exact text you want, the model places it cleanly, and you download a finished visual.
This guide is for the people who need to make a visual today, not design pros. If you’re a teacher building a classroom handout, a student making a conference poster, a marketer pushing a campaign graphic, or an office worker turning a report into a visual, this guide is for you. You’ll get a plain-English walkthrough, five copy-paste prompts, and Mac-specific steps for getting the finished file into Keynote, Preview, or a PDF.
The Key Takeaways
- ChatGPT Images 2.0 (model ID gpt-image-2) launched April 21, 2026 for Free, Plus, and Pro users.
- Thinking Mode reasons through layout before drawing and delivers the best infographic and poster results; it requires ChatGPT Plus ($20/mo) or Pro ($200/mo).
- The model renders readable text in any script, including Japanese, Korean, Chinese, Hindi, and Bengali, and outputs up to 2K resolution.
- You can generate up to 8 variations from a single prompt with consistent style across all of them.
- Fello AI bundles ChatGPT, Claude, Gemini, Grok, and DeepSeek plus GPT Image generation in one Mac app for $9.99/month.
What ChatGPT Images 2.0 Actually Does
Think of ChatGPT Images 2.0 as the first version of ChatGPT’s image tool that was built for documents, not just art. The previous generation could make a pretty picture. This one can make a pretty picture with words inside it that say what you told them to say.
A few concrete changes matter for infographics and posters. The model now thinks before it draws. When you turn on Thinking Mode, it plans the layout, picks where text goes, decides what icons fit, and then renders. It can pull live information from the web if you ask, useful for event posters, stats, and news infographics. The model can produce up to 8 images from a single prompt with consistent style across the set, which means you get variations instead of rerolling the dice.
It also fixes the text problem that made AI image tools useless for posters for three years. Headlines are readable. Bullet points land in the right order. Non-Latin scripts like Japanese or Hindi come out with proper typography, not decorative scribbles. If you’ve ever tried to make a Spanish-language classroom poster with the old DALL-E, you already know why this matters. OpenAI’s official announcement lists Japanese, Korean, Chinese, Hindi, and Bengali as the languages where text rendering made the biggest jump.
For more on the launch itself, see our GPT Image 2 launch breakdown. What follows here is the practical how-to.
How to Make an Infographic with AI on Mac in 6 Steps
Here’s the whole flow. Works in the ChatGPT Mac app, on chatgpt.com in Safari, or in Fello AI on your Mac.
- Open ChatGPT on your Mac. The native Mac app sits nicely next to Keynote and Preview. If you don’t have it yet, our guide to the ChatGPT desktop client for Mac walks through the install.
- Pick a model that supports Images 2.0. Any ChatGPT model that routes to
gpt-image-2works. On Free, you get Instant Mode. On Plus or Pro, switch to Thinking Mode for posters and infographics. - Describe your visual in four parts. Topic, the sections it should contain, the exact text that should appear inside quotes, and the visual style. This four-part structure matches OpenAI’s official prompting guidance.
- Put literal text in quotes or ALL CAPS. ChatGPT treats quoted phrases and capitals as text to render, not as instructions. This is the single biggest trick for getting words right.
- Ask for high quality and a portrait aspect ratio. Say “high quality, portrait 1024 × 1536” for posters and infographics; say “landscape 1536 × 1024” for slides or social banners. Both fit inside ChatGPT’s 2K ceiling.
- Review and iterate with one change at a time. Don’t rewrite the whole prompt. Say “keep everything the same, change the headline to ‘Spring Reading List'” and let it update.
You’ll have a finished image in roughly 30 seconds on Instant Mode, or 1 to 3 minutes on Thinking Mode.
The Prompt Formula That Works Every Time
OpenAI’s own prompting guide recommends a simple order that you should steal and reuse:
background / scene → subject → key details → constraints → purpose
Translated to English, that’s: what the canvas looks like, what’s on it, what the details are, what must not change, and what it’s for.
Here’s the universal template. Copy, paste, swap the bracketed parts:
Create a [portrait / landscape] infographic on the topic of [TOPIC].
Use a [clean flat / editorial / playful / minimalist] style with [2–3 colors].
Include four sections, in this order:
1. Headline: "[EXACT HEADLINE]"
2. Section: "[SECTION TITLE]" with the stat "[STAT]"
3. Section: "[SECTION TITLE]" with a short caption "[CAPTION]"
4. Footer: "[FOOTER TEXT]"
All text must be readable. Use high quality. Do not add watermarks or logos.
This is for [classroom / campaign / report / event].
4 Prompt Templates, One Per Persona
Each template uses the formula above and plugs in a realistic brief. The bracketed text is what the model will render literally inside the image. Copy the one that fits you, swap the content for your own, and run it in Thinking Mode.
The Teacher: classroom infographic
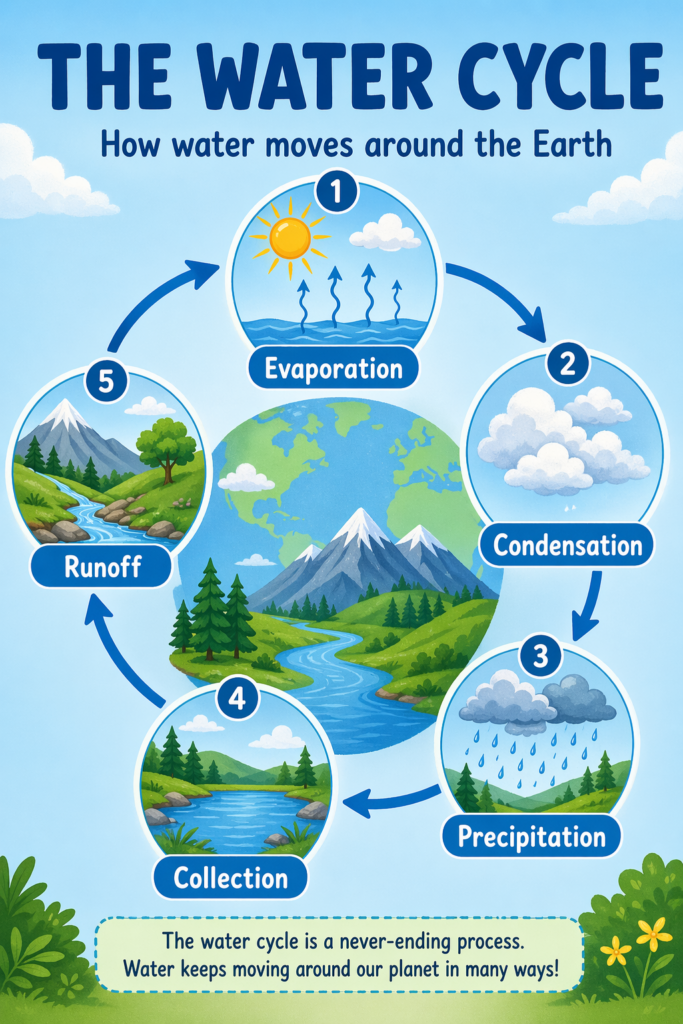
Teachers usually need a visual that’s clear from the back of the room, printable on one page, and friendly enough to hold a 10-year-old’s attention. The prompt below turns a single lesson concept into a printable handout with five legible labels in a circle:
Create a portrait classroom infographic on "The Water Cycle" for 5th-grade science.
Use a friendly, flat illustration style with blue and green as the main colors.
Include five labeled stages in a circle:
1. "Evaporation"
2. "Condensation"
3. "Precipitation"
4. "Collection"
5. "Runoff"
Add a heading "THE WATER CYCLE" at the top and a one-line caption
"How water moves around the Earth" under the heading.
All text must be readable. Portrait 1024 × 1536. High quality.
Run it in Thinking Mode and ask for 2 variations so students get a choice of color scheme. Export as PDF in Preview and print one per desk. Swap the topic (the water cycle, photosynthesis, the branches of government, times tables) and the five labels, and the same template covers every subject you teach.
The Student: research poster
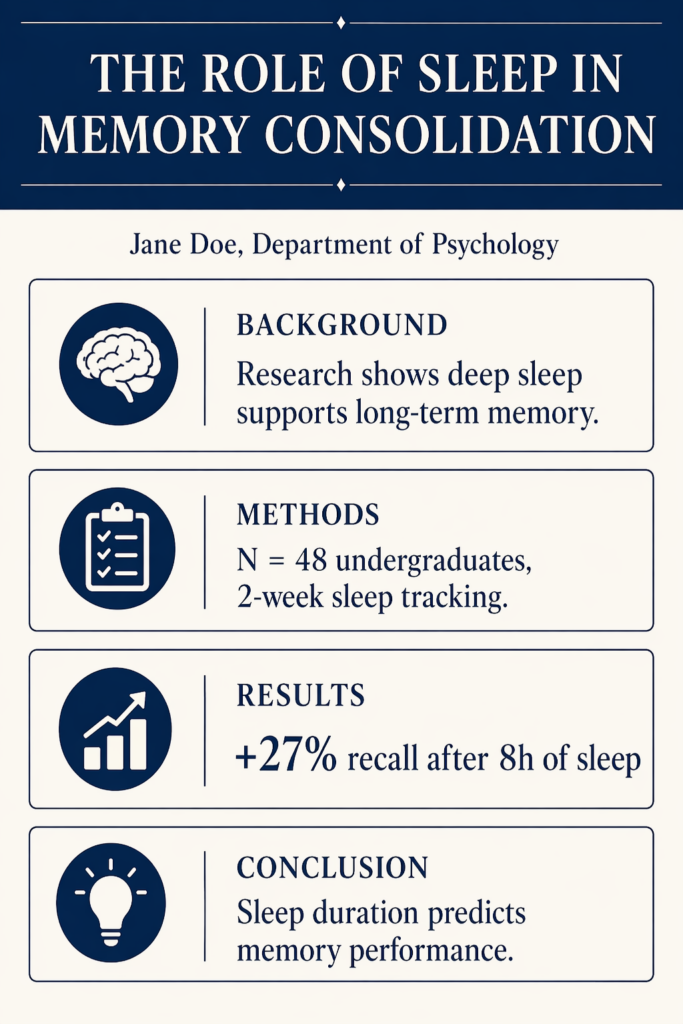
Conference and end-of-semester posters are where AI image models used to fail hardest, because poster boards live or die on readable text. ChatGPT Images 2.0 finally handles dense academic layouts. The prompt below produces a portrait poster with six labeled boxes, a clear stat block, and an editorial style that prints cleanly on foam core:
Create a portrait academic research poster titled "The Role of Sleep in Memory Consolidation."
Use an editorial, minimalist style with a navy and off-white color scheme.
Include these sections in this order:
1. Title bar: "THE ROLE OF SLEEP IN MEMORY CONSOLIDATION"
2. Author line: "Jane Doe, Department of Psychology"
3. Background box with the text "Research shows deep sleep supports long-term memory."
4. Methods box with the text "N = 48 undergraduates, 2-week sleep tracking."
5. Results box with the stat "+27% recall after 8h of sleep"
6. Conclusion box with the text "Sleep duration predicts memory performance."
Keep all text readable. Portrait 1024 × 1536. High quality. No logos.
Ask for 4 variations at the end so you can pick the cleanest layout before class. The template works for any six-section research brief; swap the title, the author line, and the box contents for your own project.
Marketing visuals need three things: a benefit headline, hard numbers, and a call to action. The prompt below builds a landscape banner with all three plus a modern gradient style that performs on LinkedIn, X, and as a dashboard header in your campaign tracker:
Create a landscape social media infographic for a B2B SaaS product launch.
Use a bold, modern style with a purple-to-pink gradient and white text.
Include:
1. Headline: "SHIP 3× FASTER"
2. Subheadline: "with Acme Ship AI"
3. Three stat blocks:
   - "47% less time in code review"
   - "2 min average PR merge"
   - "12,000 teams onboarded"
4. Call to action: "Start free at acme.com"
Landscape 1536 × 1024. High quality. No stock-photo faces.
Turn on Thinking Mode and ask for 4 variations. A/B test the two best in your campaign and archive the rest. For recurring campaigns, save the prompt in a Notes doc and update only the numbers each quarter; style consistency stays high because you’re reusing the same structural scaffold.

The Office Worker: quarterly report visual
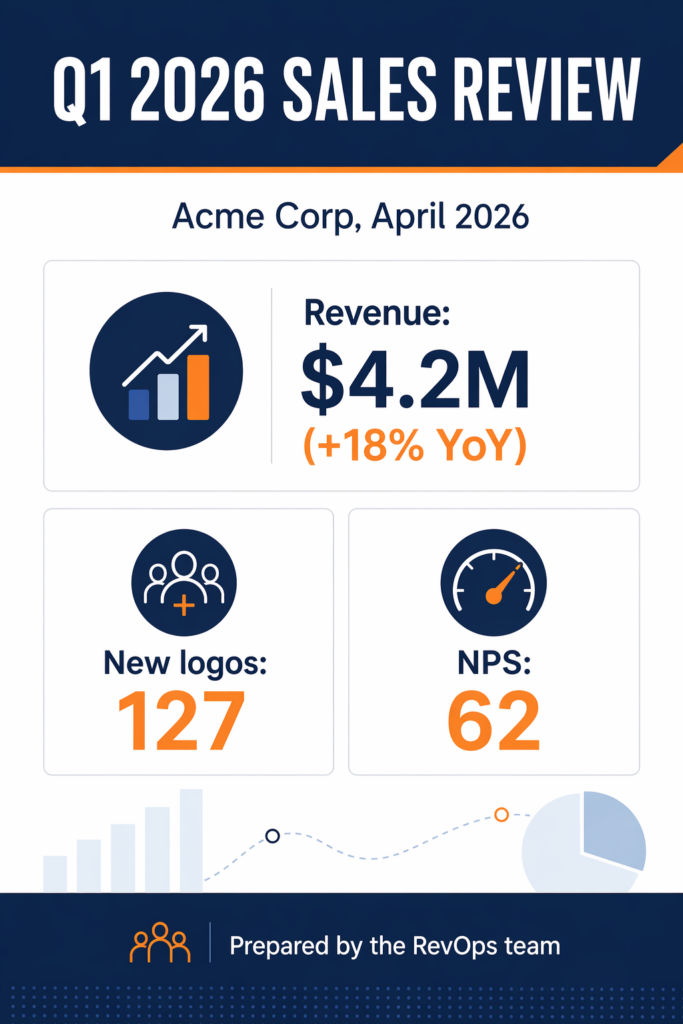
Quarterly reports used to mean fighting with a slide template, a stock-photo library, and a last-minute design request to the marketing team. The prompt below skips all three and produces a corporate report cover that you can drop straight into slide 1 of a Keynote deck:
Create a portrait report cover infographic titled "Q1 2026 Sales Review."
Use a corporate, flat style with navy and orange.
Include:
1. Title bar: "Q1 2026 SALES REVIEW"
2. Subtitle: "Acme Corp, April 2026"
3. Three KPI blocks with these exact numbers:
   - "Revenue: $4.2M (+18% YoY)"
   - "New logos: 127"
   - "NPS: 62"
4. Footer: "Prepared by the RevOps team"
All text must be readable. Portrait 1024 × 1536. High quality.
Drop the finished PNG straight onto slide 1 of your Keynote or PowerPoint deck. For the full slide-building flow from blank deck to finished report, see our how to use AI in PowerPoint guide.
Thinking Mode vs Instant Mode: When to Use Which
Both modes use the same gpt-image-2 model, but they make different trade-offs.
| Mode | Best for | Speed | Text accuracy | Tier required |
|---|---|---|---|---|
| Instant Mode | Quick drafts, simple visuals, 1–2 lines of text | ~30 seconds | Good | Free, Plus, Pro |
| Thinking Mode | Infographics, posters, dense layouts, multilingual text, web-search-grounded visuals | 1–3 minutes | Excellent | Plus, Pro |
Rule of thumb: if your visual has more than five pieces of text or real numbers that must be correct, use Thinking Mode. If it’s a social thumbnail with a two-word headline, Instant is fine. TechCrunch’s launch review confirms Thinking Mode is where the text-rendering gains show up most.
Mac-Specific Tips That Save Time
Most tutorials stop at the generation step. The real unblock on a Mac is what happens after: how you crop, annotate, drop into a deck, print, and keep your workflow sane. Five tricks will save you an hour a week once they’re muscle memory.
Use the ChatGPT Mac app, not a browser tab
The native Mac app keeps your session in a dedicated window, integrates with Spotlight-style shortcuts, and lets you drag images straight onto the canvas when you want to edit or reference them. A browser tab disappears the moment you switch to Keynote; the Mac app stays put. If you haven’t installed it yet, our ChatGPT desktop client for Mac walkthrough covers install, permissions, and the keyboard shortcut you’ll use most.
Finish everything in Preview
Preview, the free Mac app you already have, handles 90% of post-generation work. Open the PNG, drag a selection, use Tools → Rectangular Selection → Crop to trim bleed or unused space. Switch to Tools → Annotate → Text to add a company logo line, a footnote, a page number, or your name and the date for a classroom handout. When you’re done, File → Export as PDF gives you a print-ready file. No Photoshop license required.
Drop straight into Keynote or PowerPoint
Drag the PNG onto any Keynote slide. Keynote preserves full resolution, and a 1024 × 1536 portrait image stays sharp on a projector or a 4K external monitor. For decks where the whole slide is one infographic, right-click the slide background, choose Format → Image Fill, and drop the PNG in; the slide becomes the infographic with room for speaker notes below. If you want to build the entire deck in AI too, our how to transform PowerPoint with ChatGPT guide walks through the slide-by-slide flow.
Print for real life
A 1024 × 1536 portrait PNG exports cleanly to A4 or US Letter at 150 DPI, which is plenty for classroom handouts, conference poster boards, and client-ready reports. In Preview, go to File → Export as PDF, pick the size, and print. For larger posters (A3 and above), re-run the prompt with the aspect ratio set to 2560 × 1440 to give the printer more pixels to work with; ChatGPT Images 2.0 supports up to 2K natively.
Use Fello AI if you want one app for everything
If you’d rather not juggle ChatGPT Plus at $20/month, Claude Pro at another $20, and a separate image tool, Fello AI bundles ChatGPT, Claude, Gemini, Grok, and DeepSeek inside a single native Mac app for $9.99/month, with GPT image generation built in. You get the same prompt flow, the same quality, and one bill instead of four. For a broader view of what’s on the market, see our roundup of the best ChatGPT alternatives for Mac.
Which Plan Do You Actually Need?
For infographics and posters specifically, here’s the honest breakdown.
| Plan | Price | What you get | Best for |
|---|---|---|---|
| ChatGPT Free | $0 | Instant Mode only, limited daily generations | One-off social graphics |
| ChatGPT Plus | $20/mo | Thinking Mode, higher limits, 2K output | Teachers, students, marketers who need it weekly |
| ChatGPT Pro | $200/mo | Highest limits, priority access | Heavy agency use, dozens of visuals per day |
| Fello AI | $9.99/mo | ChatGPT, Claude, Gemini, Grok, DeepSeek in one Mac app with GPT image generation included | Anyone who wants multiple AI models without paying for each |
If your deliverables are dense (posters, report infographics, classroom handouts with text), you want Thinking Mode. That means Plus at minimum on the OpenAI side, or Fello AI if you’d rather get more models for half the money.
Troubleshooting: When the Output Is Off
Three fixes handle 80% of problems:
- The text is wrong. Re-enter the prompt with the text in ALL CAPS or strict quotes. Say “render this text exactly: ‘SPRING 2026 FIELD TRIP'”.
- The layout is cluttered. Ask for “more whitespace, larger type, fewer icons.” Images 2.0 responds well to whitespace instructions.
- The style drifts between variations. Use “keep the same style, palette, and typography as the previous image” at the start of your next prompt.
For the full technical breakdown of what changed, our GPT Image 2 launch coverage covers every new feature.
Conclusion
ChatGPT Images 2.0 is the first version where any non-designer can produce a usable infographic or poster in under five minutes. The tricks are simple: write exact text in quotes, use Thinking Mode for anything with more than five labels, specify the aspect ratio in pixels, and iterate one change at a time.
If you only remember one thing from this guide, it’s the prompt formula: topic → sections → exact text → style → purpose. That structure carries you from a blank canvas to a finished classroom handout, campaign asset, or report cover faster than any design tool you’ve used.
Ready to try it? Open the ChatGPT Mac app, or get ChatGPT, Claude, Gemini, Grok, and DeepSeek in one app on your Mac with Fello AI for $9.99/month.
FAQ
Can ChatGPT really make a full infographic now?
Yes. ChatGPT Images 2.0, released April 21, 2026, renders readable text inside images and plans layout before drawing. That’s what makes it usable for infographics and posters instead of just illustrations.
Do I need ChatGPT Plus to make posters?
Not to start. Instant Mode works on the Free tier. For posters and anything with more than a few lines of text, you want Thinking Mode, which requires ChatGPT Plus at $20/month or Pro at $200/month. Fello AI at $9.99/month is a cheaper way to access a similar stack alongside four other models.
How do I make ChatGPT include exact text in an image?
Put the text in quotes or ALL CAPS inside your prompt. Example: Add a headline “SPRING 2026 FIELD TRIP” at the top. The model treats quoted phrases and capitals as text to render literally.
What aspect ratio should I use for a poster?
Portrait 1024 × 1536 for standard posters, handouts, and report covers. Landscape 1536 × 1024 for slides, social banners, and dashboards. ChatGPT Images 2.0 supports aspect ratios from 3:1 to 1:3 and up to 2K resolution.
Can Fello AI make infographics too?
Yes. Fello AI includes GPT Image generation inside a single Mac app that also bundles ChatGPT, Claude, Gemini, Grok, and DeepSeek for $9.99/month. Support for the newest ChatGPT Images 2.0 model is rolling out.